Turn data into knowledge
At Safe Online, we work to make data handling as easy and efficient as possible. That is why we are proud to present DataMapper’s new integration for Power BI – one of the market’s most popular Business Intelligence solutions. With the integration, you can now combine DataMapper’s data analysis with Power BI’s advanced visualizations and interactive reports. Together, it provides a strong foundation for strategic decisions based on your company’s most important data points.
What can Power BI do for you?
With the Power BI integration, you get a better overview of the company’s data management. There are five areas in particular that Power BI can help with.
- Customised reports: Access detailed key figures and create tailor-made reports that suit your needs.
- Visualize statistics: Create interactive visualizations that make it easy to present and understand complex data.
- Transfer data: Power BI integrates seamlessly with Excel and other Microsoft products, so you can export data directly to your existing systems.
- Make decisions: With precise data and interactive reports, you get a solid basis for making better and more informed decisions.
- Set up notifications: Set up email notifications of reports to different levels of the organisation
Case: How a company utilised Power BI
A company in the financial sector faced a challenge; they needed to get an overview of the way they handled GDPR data, so they could ensure that the processing was in line with their privacy policy. With DataMapper, they quickly gathered information about data processing activities and put it directly into Power BI. There were three issues in particular that the company used Power BI to create an overview of:
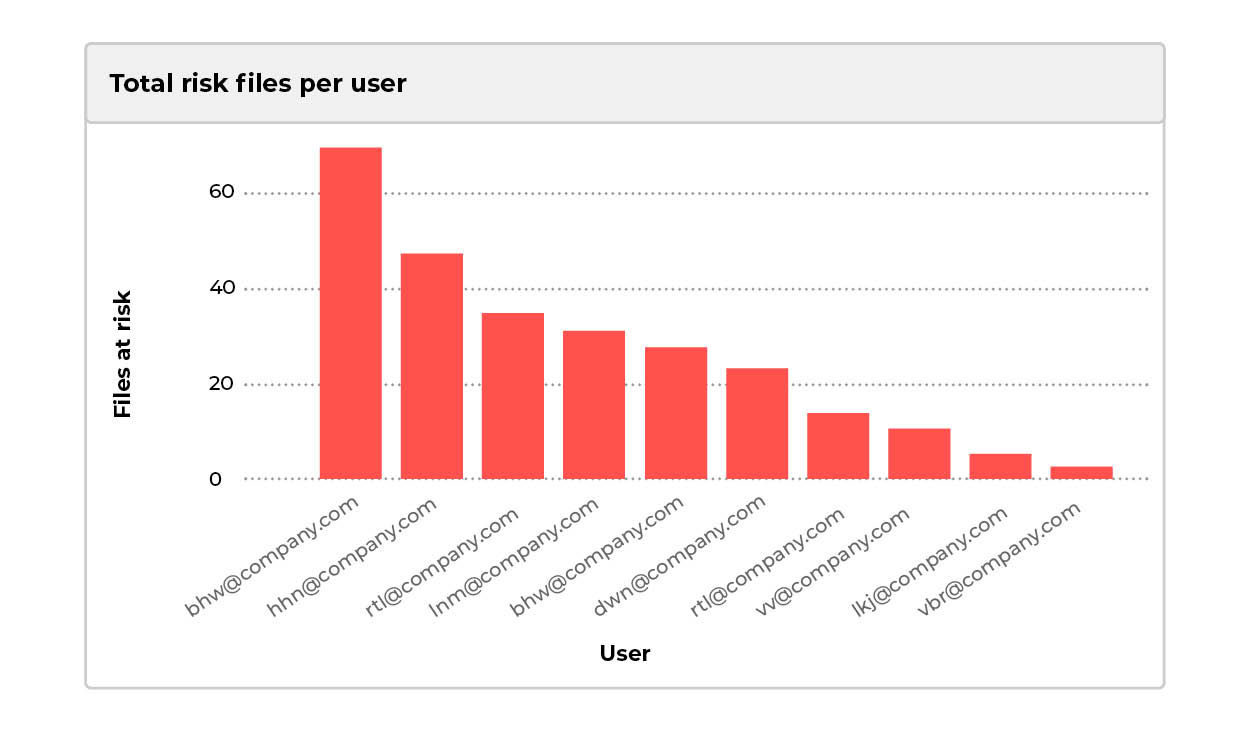
1. Which employees need to clean up?
Using Power BI’s advanced visualisation, the company produced a bar chart where the email of users is on the x-axis and the number of files at risk is on the y-axis. The company did this in the departments in the company where you needed to get an overview. By doing this, the company got a clear picture of how many files the individual user has for each department, and who in the department needs to clean up . In the wake of the report, email notifications were set up for the department managers in the company, so that each manager was informed in the future about which employees in the department needed to clean up:
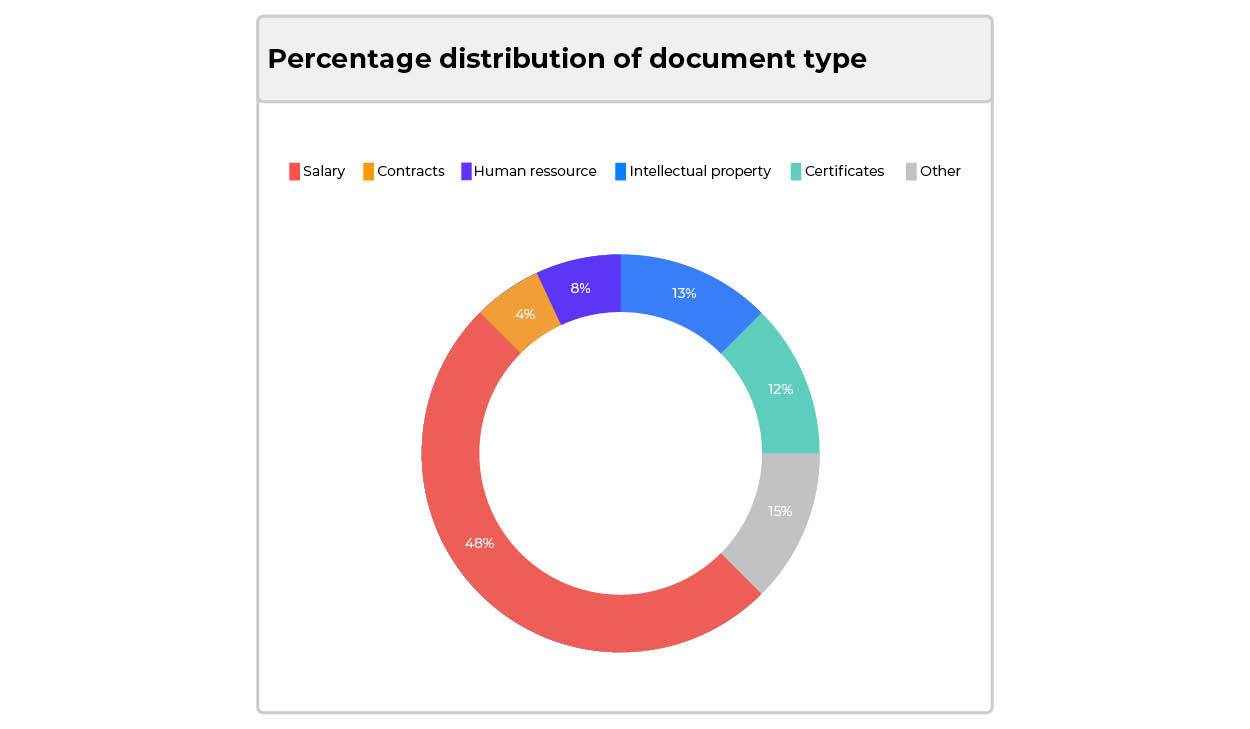
2. What types of documents do we have at risk?
The company created a pie chart which showed the percentage distribution of document type in the company. By doing this, the company got a clear picture of which type of documents the company had at risk:
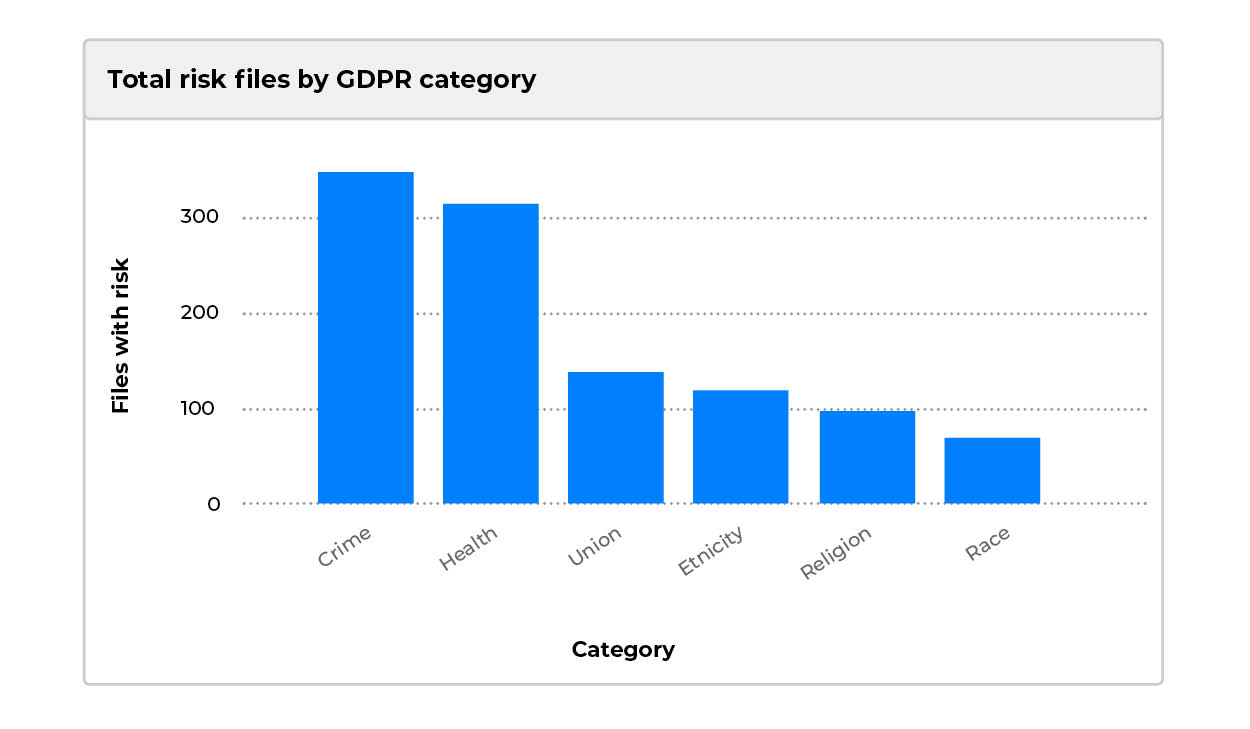
3. Which term do we have the most in the GDPR category "Crime"?
The company created a custom bar chart where GDPR categories are on the x-axis and number of files at risk is on the y-axis. By doing this, the company got a clear picture of which GDPR categories appear most frequently in their data:
These three reports are just a few examples of reports that can be generated and used as a solid foundation for strategic decision making. With PowerBI, you as a company can get the right data insights to identify patterns, optimize processes and ensure that decisions are made on an informed and data-driven basis.
Get started today
Do you want to experience the benefits of DataMapper and Power BI? Contact us and let us help you create an overview and take action.

Sebastian Allerelli
Founder & COO at Safe Online
Sebastian is the co-founder and COO of Safe Online, where he focuses on automating processes and developing innovative solutions within data protection and compliance. With a background from Copenhagen Business Academy and experience within identity and access management, he has a keen understanding of GDPR and data security. As a writer on Safe Online's Knowledge Hub, Sebastian shares his expertise through practical advice and in-depth analysis that help companies navigate the complex GDPR landscape. His posts combine technical insight with business understanding and provide concrete solutions for effective compliance.